Problem with monitoring (Grafana & Prometheus)
May 11th, 2021
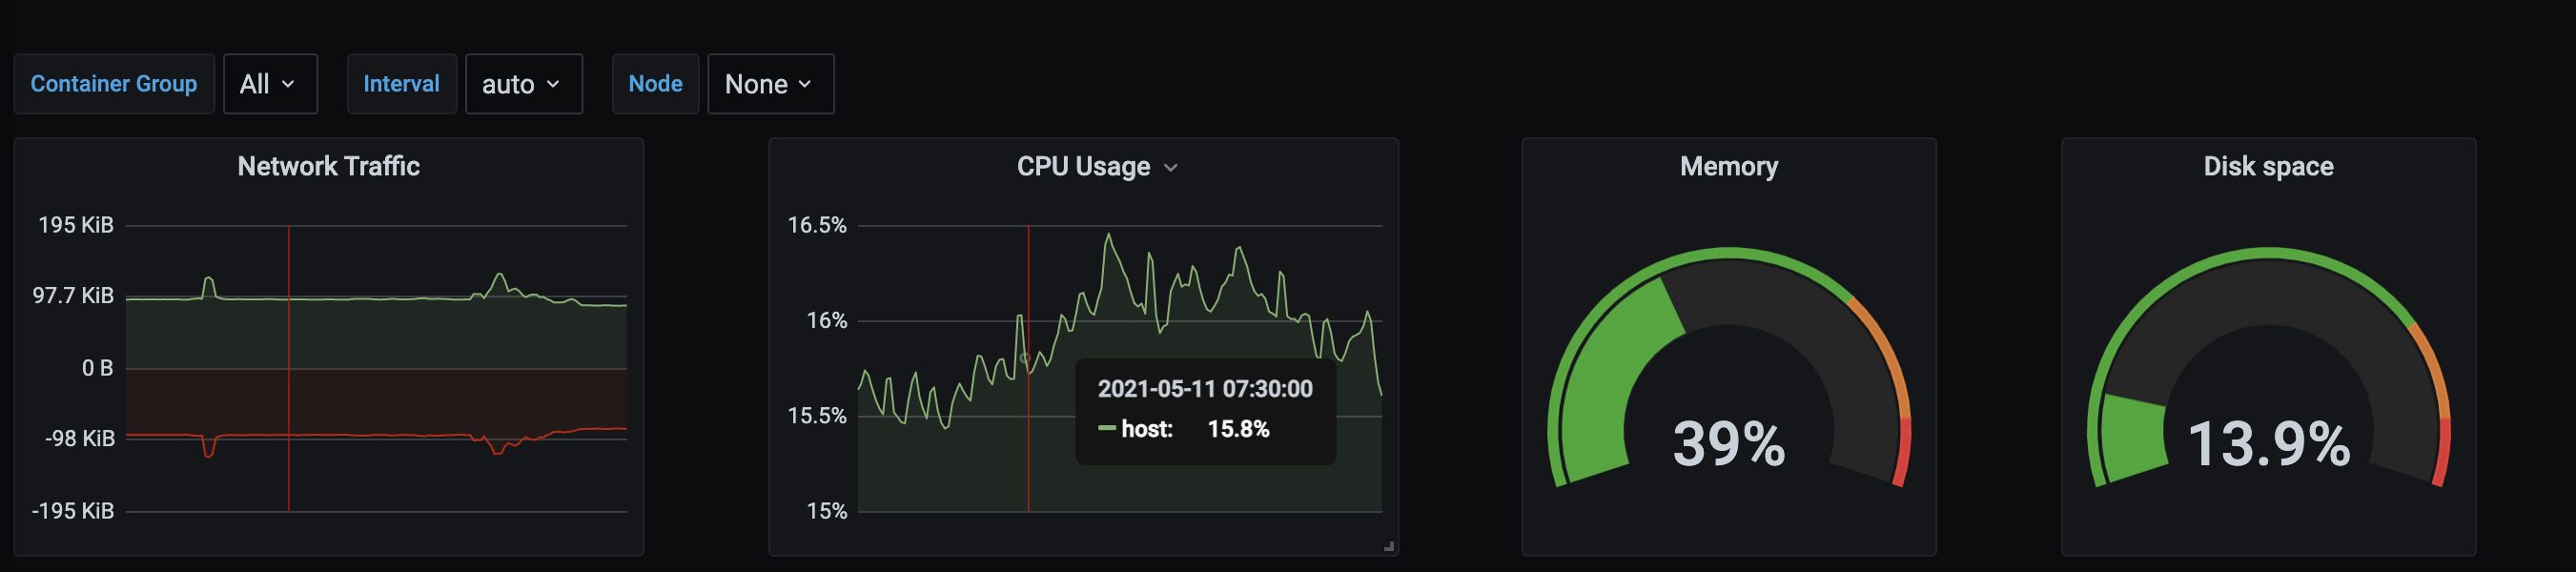
Most common open-source monitoring stack for monitoring servers is Grafana with Prometheus.
They are great when you have time to set up everything you need, especially Grafana is very customizable, but designing your own Grafana dashboard is not a trivial task.
The solution for this is using Grafana dashboards made by other people, which kind of works but when you need to customize it, you have to either look at a usually huge JSON file which is not intuitive or by editing via Grafana UI. The second option is OK, but still not ideal (still takes some time).
Another issue is when you download the dashboard and start to use it, not all Prometheus queries might work, so you have to look at them, analyze and fix them case by case.
It's very nice to have somebody to generate dashboard for you, so you don't have to, but it's mostly random people and quality of them isn't always great or sufficient and you still have to tweak it to your needs. You don't have (at least not in my experience) official dashboard for product ABC made by company XYZ which owns this same product same way as it works with Docker Hub or NPM registry in most cases.
I don't want to spend days or weeks tweaking monitoring of my servers, just to monitor basic things like CPU/Memory/Disk usage etc.
One solution might be a CLI utility to generate your own Grafana dashboard file based on parameters what you want to monitor how you want to have an alert set up etc. just very opinionated, let's say I choose I want to monitor CPU/monitoring/memory usage but not memory swap or disk usage. Then you can set up monitoring things - I want to send info to Slack/Teams/Email etc. Finally this CLI will generate the config files.